THE BIG READ · GLOBAL FINANCE
The Great
Financial
Convergence
Banks are adopting the tools of fintech. Fintechs can seek the powers of banks. Africa reveals why the road to a shared financial future is far from uniform.
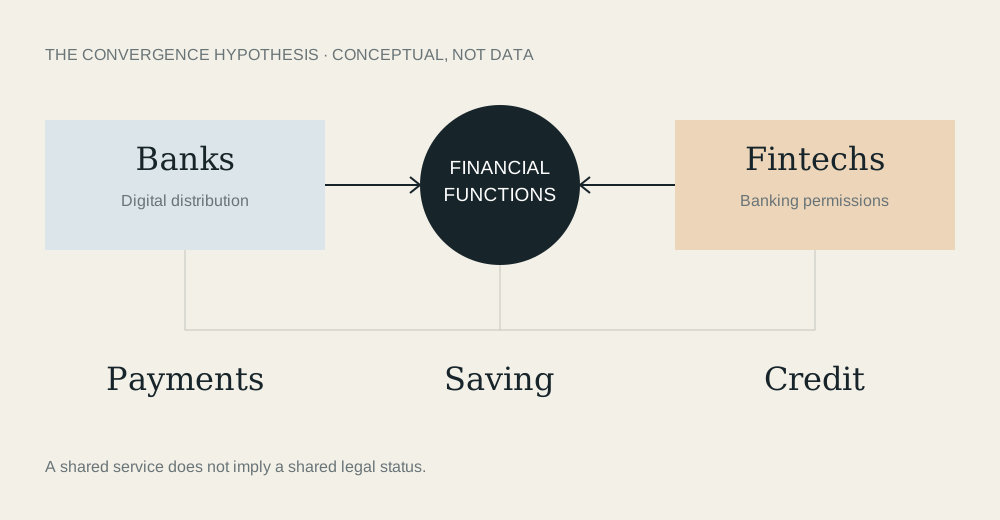
The familiar division between a bank and a technology company becomes less useful when both offer a way to pay, save or borrow. Yet a similar customer experience can conceal very different institutions.
A banking app may belong to an incumbent with a deposit-taking licence. A fintech interface may depend on a licensed partner. A mobile money account may provide an entry into formal finance without making its provider a bank. The screen alone cannot reveal where the legal permissions, financial obligations and infrastructure sit.
That is the central question behind the great financial convergence: are financial institutions becoming more alike, or are different institutions finding new ways to perform the same functions?
The Basel Committee’s 2024 report on digitalisation provides a framework for examining new technology and new suppliers of banking services. But measuring institutional change requires evidence beyond the number of people who own an account.
A wider doorway
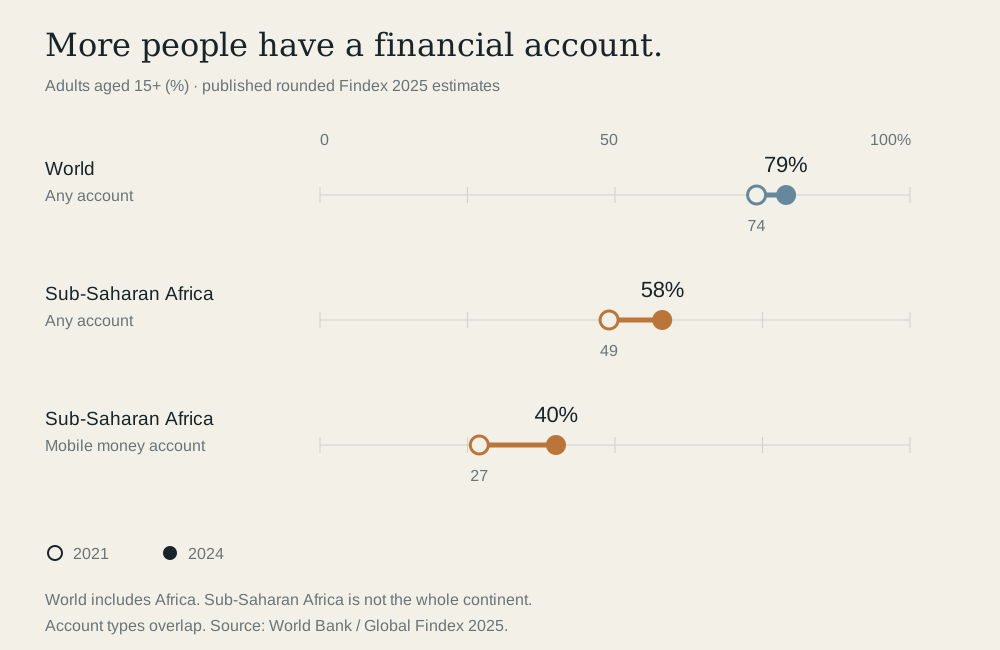
Access offers a useful starting point. On the World Bank’s 2025 Findex publication basis, global account ownership rose from 74% of adults in 2021 to 79% in 2024. This is a broad measure: it includes accounts at financial institutions and mobile money providers.
It tells us that more people have a doorway into finance. It does not tell us how often they use it, whether the service is affordable, or whether a fintech is becoming a bank.
Africa’s different route
In Sub-Saharan Africa, the same publication reports overall account ownership of 58% in 2024, compared with 49% in 2021. Mobile money ownership rose from 27% to 40%. These categories overlap: someone can hold both a mobile money account and an account at a financial institution.
The regional contrast invites a different question. Where access expands through mobile money, should the story be framed as fintech becoming banking—or as a broader range of providers delivering financial functions?
Answering that question means separating adoption from institutional identity. A mobile money statistic counts adult access under a survey definition. It does not describe the licence held by the provider, the bank behind a partnership or the distribution of risk.
There is no single African story
A regional average can hide striking differences. The country observations below illustrate the range across selected African economies, including North Africa. They come from the World Bank’s account-ownership indicator, retrieved on 13 October 2026, and are rounded to one decimal place.
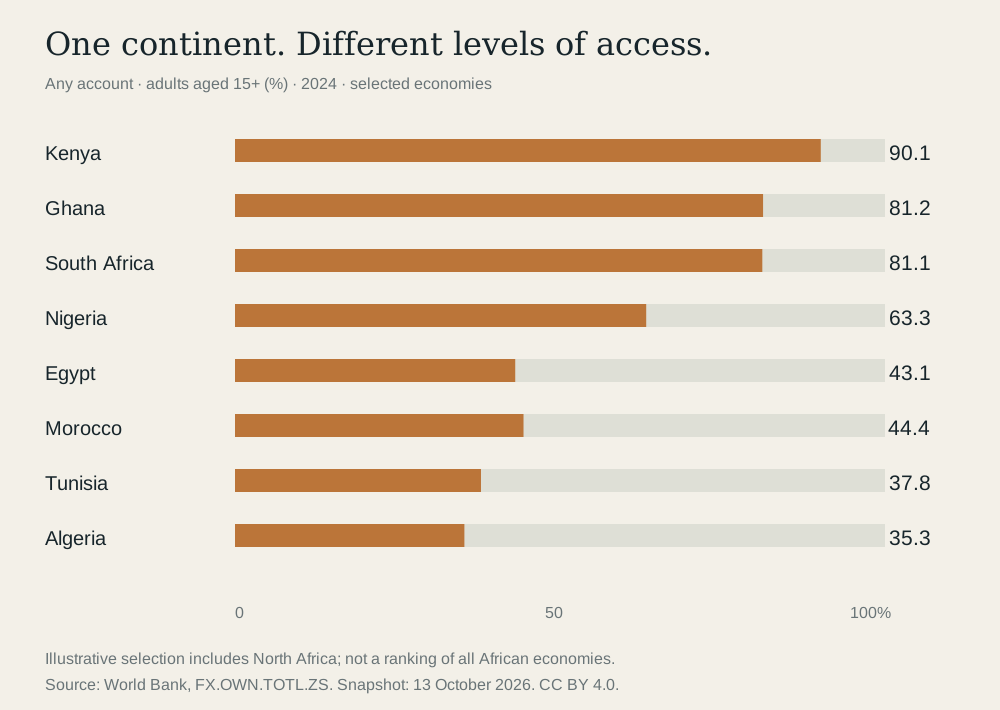
Country percentages allow us to see differences. They do not produce a valid “Africa versus the rest” aggregate by themselves. That comparison would require a defined continental membership, compatible adult-population weights and a clear account of missing observations.
Nor should Sub-Saharan Africa stand in for the continent. North Africa belongs in the analysis; a regional label that includes countries outside Africa cannot simply be substituted for it.
What would prove convergence?
A persuasive institutional account needs three kinds of evidence. First, dated changes in legal permissions: which fintech-origin entities obtained which licences, in which jurisdictions, with what restrictions? An application and a full deposit-taking licence are different events.
Second, comparable bank disclosures: digital usage, active customers and transaction shares with explicit denominators. Third, verified operating relationships: which services depend on bank partners or shared infrastructure, and whether those relationships are merely announced or actually functioning.
Those records are the next layer of this research. Until they are reviewed, the access data should be read as evidence about participation, not as proof that institutional boundaries have disappeared.
The financial future may look increasingly similar on a phone. Understanding it requires looking behind the screen.
SOURCES & EDITORIAL NOTES
How to read these visuals
Country data are exact-year World Bank API snapshots; no values were fabricated, imputed or carried forward. Regional figures are separately transcribed, rounded Findex 2025 summaries. They are not computed from the country chart. The 2025 publication uses a revised 2021 world estimate; older releases must not be spliced into this comparison. Changes in coverage, survey design and definitions limit inference. No confidence intervals or causal conclusions are presented.
The original quotation’s attribution to a World Bank president has not been verified and is not used as a quotation. The conceptual opening diagram describes a research hypothesis, not a documented flow of firms.
| Economy | Account ownership (% adults 15+) |
|---|---|
| Kenya | 90.1% |
| Ghana | 81.2% |
| South Africa | 81.1% |
| Nigeria | 63.3% |
| Egypt | 43.1% |
| Morocco | 44.4% |
| Tunisia | 37.8% |
| Algeria | 35.3% |
Reuse: download the conceptual diagram, access chart and Africa chart. Keep the captions and attribution with the visuals. This article is a static editorial edition.